 I think SWS and the media are ALL WET on their interpretation of these hunger statistics. Here is why...
Every three months since July, 1998, the Social Weather Stations public opinion pollster conducts a "self-reported hunger survey" among Filipino heads of households in which it asks the following question:
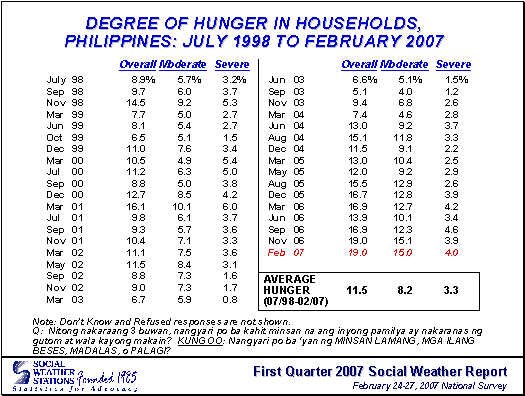
Nitong nakaraang 3 buwan, nangyari po ba kahit minsan na ang inyong pamilya ay nakaranas ng gutom at wala kayong makain? Kung OO: Nangyari po ba yan nang MINSAN LAMANG, MGA ILANG BESES, MADALAS O PALAGI? [During the last three months, has it happened even once that your family experienced hunger and you had nothing to eat? If YES, did that happen only once, several times, often or all the time?]The Table above is taken from the SWS Website and contains all the raw data from July 1998 to February 2007. Below I've prepared a chart based on the Severe Hunger data column and the Total Hunger data column from this Table.
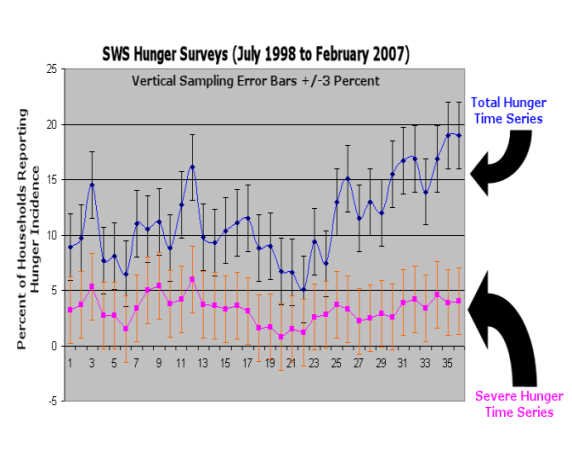
The Severe Hunger incidence is shown in hot pink with orange vertical sampling error bars of +/- 3 percent, while the blue time series represents the sum of severe, moderate and occasional hunger incidence reported by the 1200 randomly sampled respondents (all heads of households).
Inspection of these charts (click on them to zoom) leads to several simple and direct conclusions:
(1) Within the sampling error margins of + or - 3 percent for the data, the incidence of SEVERE HUNGER (often or always) has been CONSTANT throughout the entire survey period of almost ten years -- (in fact a trend line in Excel shows a slight decrease!).
(2) The TOTAL HUNGER data shows an apparent upward trend, but the following suggestive features are visible by inspection (as opposed to Fourier or other fancy analysis):
(a) There is a definite PERIODIC or CYCLIC component to the data on hunger incidence which shows local maxima (peaks) in each of the four election years during the survey period (1998, 2001, 2004 and if the trend continues through this year, in 2007 also).
(b) These maxima seem to occur in the quarter immediately preceeding Christmas season during the years 1998, 2001 and 2004.
(c) The upward trend as well as these seasonal variations (before Christmas in election years) cannot be attributed to the SEVERE HUNGER incidence because as we have noted, that data is CONSTANT within the sampling error margins.
(d) Thus all the variations in the data are due to self-reported "occasional" or "moderate" hunger incidence. That may be an effect of election and Christmas time attitudes of the population, i.e., they expect politicians to help them and so they report more hunger or need during these periods.
"There are three kinds of lies: LIES, DAMNED LIES, and STATISTICS"... (Ben Disraeli or Mark Twain)
No doubt there is persistent severe hunger in the country at around 3 to 4% incidence. But I cannot think of a better example from the third category above than the spin and propaganda based on these self-reported statistics on hunger in the Philippines which are foisted on a gullible public every three months by SWS, the mass media and anti-government pundits. They ever-ready to turn self-proclaimed "scientific" survey findings into screaming headlines and ditzy talk show comments, as I heard from Korina Sanchez this week on this matter. Frequently, what the media reports as "changes" or "record levels" of hunger, are actually random statistical variations that are produced seasonal variation and other factors that have no direct or even contrary connection with those phenomena.
Now don't get me wrong, when the SWS conducts surveys whose results will actually be confirmed or contradicted by subsequent objective events--like the voter preference surveys-- can generally be relied upon to be valid as their own historical record proves. But when it conducts surveys that can never be validated or invalidated by some independent or objective event like an election, the results have little statistical or scientific merit.
It is a little-known and vastly under-appreciated fact that not all SURVEY QUESTIONS are valid statistical survey questions! Not all survey questions are "good" survey questions, so that if you ask a "bad" or logically flawed survey question, the results will be of questionable validity even if you use exactly the same thoroughly scientific method to gather and analyze the data. For example, the SWS uses the same random sampling techniques and questionnaire presentation methods to gather data for voter preference surveys and the self-rated hunger surveys. Likewise they use the same mathematical and statistical algorithms to analyze those results. But it's really garbage in, garbage out if the survey question being asked is an invalid or "bad" survey question. It's a little like a technically competent violinist playing the same piece of music on a properly tuned Stradivarius as opposed to his shoestrings.
But what makes for a good or a bad survey question for the purposes of conducting a valid survey after assuming that the data collection and data analysis portions are done by the same completely honest and competent pollster?
The answer can be seen in contrast with the "good" survey question that SWS asks in voter preference polls. When they ask, which President or senators you would vote for if the election were held today, all the respondents probably understand the meaning of the question in pretty much the same way. The meaning of the question is definite and the choice of answers is really quite limited. However, "hunger" can mean many things to different people, and even different things to the same person at different times and seasons. And "not having any food to eat" does not mean that they could not get food if they really wanted to. Also, since the Catholics and Muslims obey religious food customs at Lent and Ramadan, these could be a source of the odd periodicity and cyclic behavior of the time series data. There are other factors at play here than what the usual suspects in media and punditocracy take to wringing their hands over.
Again, this is not to deny the constancy of the severe hunger incidence, but it should provide, uhmm FOOD FOR THOUGHT about the claim that ONE in FIVE or 18 MILLION Filipinos are starving or going hungry for lack of food and that hunger is at RECORD LEVELS. It certainly is not for the severely deprived and hungry, and hyping the data might not really help them if we act upon false premises due to wrong interpretations.
To me, these conclusions are not supported by SWS's own raw data and are merely the statistical variations to be expected from the random sampling errors and other more interesting reasons, like elections and Christmas.
Moreover, the self-reported hunger and poverty surveys of SWS are NOT, strictly speaking, on the same level of scientific quality as the voter preference surveys, for the simple reason that there is no independent, objective process to confirm or validate the results. This is what lends the hunger and poverty surveys to propagandistic or ideological spin, since all that is left is the hunt for reasons as to why there is so much hunger. Yet we are forced to the conclusion that there may not be as much hunger as we think at all, just a lot of pollsters and media folks HUNGRY for sensational headlines!
5 comments:
my problem with self rated surveys is that they could never be actionable. one could never use it for policy making purposes. sometimes i wonder if self rated survey stats like hunger is related to political perception. is it possible that when the ruling party is unpopular, people might say they are getting hungrier because they want to punish the party in power? is it related somehow to the revolution of rising expectations? take note that in the last few years, the philippine economy has been growing within the 5-6 percent band, the stock market for a while was doing great, the banks' growth in GVA has been growing in double digit growth, and the property sector is recovering fast. could it be that people who feel they are not partaking of these gains, who felt left behind, are "complaining" hunger? certainly that's a legitimate complaint. take note that "extreme hunger" has remained constant.... just thinking out loud.
Good thinking, Dave. There is another puzzler...in several of the hunger and poverty surveys, the "hunger" peaks even as the "poverty" troughs! seems they are anti-correlated. hmmm...
i asked a similar question to dr tabunda of pulse asia and she said that self rated poverty is somehow related to inflation trends. when inflation rates tick up, people tend to feel poorer, and its logical because we lose purchasing power through higher changes in the consumer price index.
by the way, congrats to you for being finalist in the 2007 blog awards! im putting my bet on you to win that one.
Thanks Dave, but please vote for one of the other nominees. Tried to get them to remove me from the beauty contest, but it appears we are not free to decline the nomination. I've no use for such awards,where I think it is mainly the organizers and their blogs that benefit. I think they should allow bloggers who don't want to be part of it to OPT out. I tried to do so but was turned down.
Hi, Dean: how are you?
Here's my alternative take on the issue:
http://villageidiotsavant.blogspot.com/2007/03/height-and-hunger.html
Post a Comment